Last week, I posted a word cloud I made with the descriptions from a thousand recent startups on Crunchbase. The (not so surprising) result was that the most popularly used word was "platform." Other likely contenders like "app", "mobile" and "data" ranked highly as well:

As fun as that cloud was, I realized there was another interesting way to use that data: to tell us something about geography, and what different regions' startups are specializing in.
To answer that question, I made a new dataset with company descriptions from over three thousand startups founded since 2015 in San Francisco, Silicon Valley, Boston, LA and NYC. Next, I compared the most used words in each geography to the most used words in the overall group, creating new word clouds that show what types of startups these areas over-index toward. Here are the results.
San Francisco: Tools for sales enablement, health, with heavy emphasis on product and consumers.

Silicon Valley: A stark contrast vs. SF with a focus on hard tech: infrastructure, cybersecurity, big data, the cloud, autonomous driving and artificial intelligence.

New York: New York's traditional stomping grounds are well represented: finance (investors, business, real estate, marketplaces) and media (news, marketing, media). Curiously Women were well overrepresented (on a relative basis). Also on-demand, because after all it is New York.

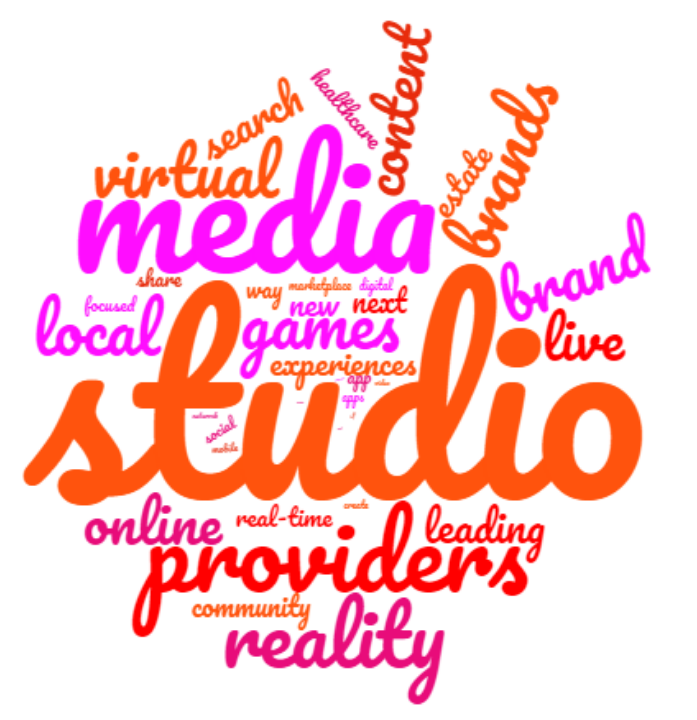
LA: Unsurprisingly, a clear focus on media and entertainment, with "virtual reality" and terms like "live" and "real time" showing strongly.

Boston: I think my methodology gave Boston the short end of the stick here from a tech perspective, but I'll publish the results regardless (journalistic integrity ftw!). Boston clearly stands apart as a center of innovation in biotech and pharma, which dominated its data (remember this is measured on a relative basis, and the other cities included have more limited footprints in these industries). Using the exact same methodology as the other four regions, Boston looks like this.

Methodology:
Data was pulled from Crunchbase, filtering for companies with over $500k raised, founded after 2015, in each of the cities in question.
The company descriptions were collated and then run through a linguistic analysis tool that rendered word counts for each individual work.
The same process was repeated for each area's companies on their own.
For each term, I calculated a relative difference (% different from the combined list). So for example if platform was 4% of global words and 5% of San Francisco words, the value was 25%.
I also calculated the absolute difference (so in the last example, 1%).
To normalize, I multiplied the absolute difference by the relative difference.
That product was used to build the word clouds above (higher value = larger presence in the world cloud).
Comments